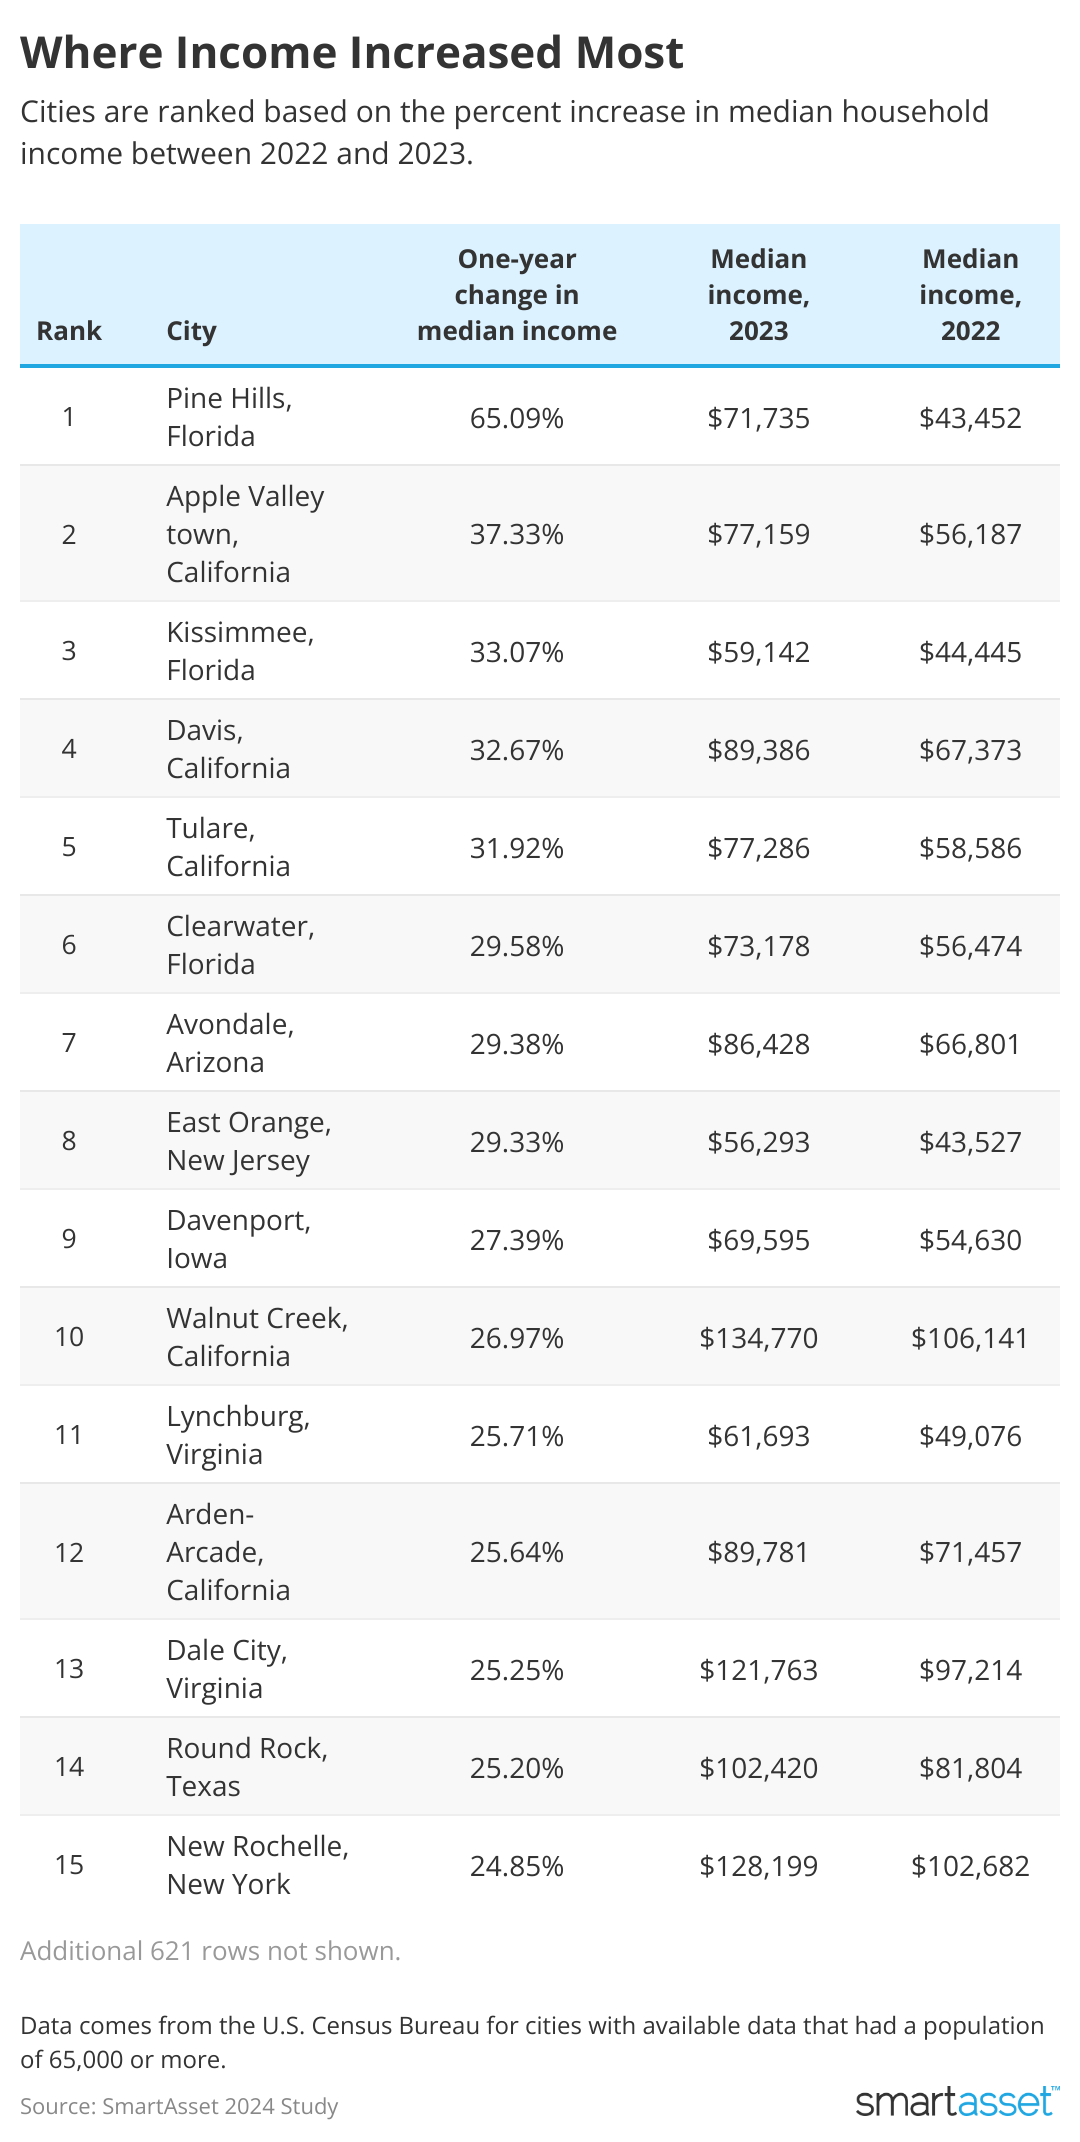
SevenMaps // Shutterstock Inflation regularly increases the prices of goods, services, and resources, making the cost of living less affordable with a dollar that does not keep up with that growth. The Bureau of Labor Statistics clocked the 12-month inflation rate from the end of 2022 to the end of 2023 at 3.35%. Meanwhile, household income estimates shifted a median of 4.22%, but swung as much as multiples above or below that–depending on the city–offsetting or exacerbating the impacts of price changes. With this in mind, SmartAsset ranked 636 cities based on the percent change in median household income over one year, according to the latest data from the Census Bureau. Key Findings Pine Hills, FL saw the highest increase in median income. The median income rose by an estimated 65% in Pine Hills, going from $43,452 in 2022 to $71,735 in 2023. The share of households earning over $100,000 per year increased from 15.2% to 27.4% in this timeframe, helping to bolster the median. Income rose by over 30% in four other cities. Rounding out the top five, Apple Valley, CA saw a 37.3% increase in median household income, with residents nearly at par with the U.S. median in 2023 at $77,159. Kissimmee, FL ended 2023 with a slightly lower-than-average median income at $59,142 after a 33.1% increase. Davis, FL incomes grew by 32.7%, landing at $89,386. In fifth place, Tulare, CA households earned a median of $77,286 after a 31.9% annual increase. The median income in this city is nearly $239,000. Sammamish, WA had the highest median income in 2023 at $238,750. This comes after a 6.7% increase from $223,849. Additionally, 57.9% of households earned more than $200,000, while 82.8% of households earned more than $100,000. Households in this city saw a nearly 18% drop in median household income. Marysville, WA had the largest drop in income, going from $104,433 in 2022 to $85,708 in 2023. Other cities with the largest drops include Champaign, IL (-17.7%); Madera, CA (-17.5%); Baton Rouge, LA (-17.2%); and Union City, CA (16.2%). Top 10 Places Where Income Increased the Most SmartAsset Cities are ranked according to the percent change in estimated median household income between 2023 and 2022. Pine Hills, Florida One-year change in median income: 65.09% Median income, 2023: $71,735 Median income, 2022: $43,452 Percent of households earning $100k or more, 2023: 27.4% Percent of households earning $100k or more, 2022: 15.2% Percent of households earning $200k or more, 2023: 1.8% Percent of households earning $200k or more, 2022: 4.5% Apple Valley, California One-year change in median income: 37.33% Median income, 2023: $77,159 Median income, 2022: $56,187 Percent of households earning $100k or more, 2023: 38.4% Percent of households earning $100k or more, 2022: 24.5% Percent of households earning $200k or more, 2023: 6.9% Percent of households earning $200k or more, 2022: 7.8% Kissimmee, Florida One-year change in median income: 33.07% Median income, 2023: $59,142 Median income, 2022: $44,445 Percent of households earning $100k or more, 2023: 25.7% Percent of households earning $100k or more, 2022: 17.5% Percent of households earning $200k or more, 2023: 3.2% Percent of households earning $200k or more, 2022: 1.8% Davis, California One-year change in median income: 32.67% Median income, 2023: $89,386 Median income, 2022: $67,373 Percent of households earning $100k or more, 2023: 44% Percent of households earning $100k or more, 2022: 39.9% Percent of households earning $200k or more, 2023: 21.3% Percent of households earning $200k or more, 2022: 18.2% Tulare, California One-year change in median income: 31.92% Median income, 2023: $77,286 Median income, 2022: $58,586 Percent of households earning $100k or more, 2023: 41.2% Percent of households earning $100k or more, 2022: 26.4% Percent of households earning $200k or more, 2023: 7.7% Percent of households earning $200k or more, 2022: 6.3% Clearwater, Florida One-year change in median income: 29.58% Median income, 2023: $73,178 Median income, 2022: $56,474 Percent of households earning $100k or more, 2023: 38.4% Percent of households earning $100k or more, 2022: 27.6% Percent of households earning $200k or more, 2023: 9% Percent of households earning $200k or more, 2022: 9.7% Avondale, Arizona One-year change in median income: 29.38% Median income, 2023: $86,428 Median income, 2022: $66,801 Percent of households earning $100k or more, 2023: 42.5% Percent of households earning $100k or more, 2022: 34.4% Percent of households earning $200k or more, 2023: 9.6% Percent of households earning $200k or more, 2022: 5.1% East Orange, New Jersey One-year change in median income: 29.33% Median income, 2023: $56,293 Median income, 2022: $43,527 Percent of households earning $100k or more, 2023: 24.8% Percent of households earning $100k or more, 2022: 22.4% Percent of households earning $200k or more, 2023: 7.2% Percent of households earning $200k or more, 2022: 4.6% Davenport, Iowa One-year change in median income: 27.39% Median income, 2023: $69,595 Median income, 2022: $54,630 Percent of households earning $100k or more, 2023: 29.8% Percent of households earning $100k or more, 2022: 22.4% Percent of households earning $200k or more, 2023: 5.3% Percent of households earning $200k or more, 2022: 3.5% Walnut Creek, California One-year change in median income: 26.97% Median income, 2023: $134,770 Median income, 2022: $106,141 Percent of households earning $100k or more, 2023: 62.4% Percent of households earning $100k or more, 2022: 51.8% Percent of households earning $200k or more, 2023: 31.7% Percent of households earning $200k or more, 2022: 31.2% Top 10 Places With the Highest Median Income Cities are ranked according to the highest estimated median household income in 2023. Sammamish, Washington Median income, 2023: $238,750 Median income, 2022: $223,849 One-year change in median income: 6.66% Percent of households earning $100k or more, 2023: 82.8% Percent of households earning $100k or more, 2022: 78.8% Percent of households earning $200k or more, 2023: 57.9% Percent of households earning $200k or more, 2022: 54.8% San Ramon, California Median income, 2023: $195,491 Median income, 2022: $192,291 One-year change in median income: 1.66% Percent of households earning $100k or more, 2023: 75.7% Percent of households earning $100k or more, 2022: 76.2% Percent of households earning $200k or more, 2023: 48.7% Percent of households earning $200k or more, 2022: 48.7% Bethesda, Maryland Median income, 2023: $191,198 Median income, 2022: $158,720 One-year change in median income: 20.46% Percent of households earning $100k or more, 2023: 73.2% Percent of households earning $100k or more, 2022: 68.5% Percent of households earning $200k or more, 2023: 48.7% Percent of households earning $200k or more, 2022: 39.6% Sunnyvale, California Median income, 2023: $189,443 Median income, 2022: $169,781 One-year change in median income: 11.58% Percent of households earning $100k or more, 2023: 74.2% Percent of households earning $100k or more, 2022: 68.8% Percent of households earning $200k or more, 2023: 48.6% Percent of households earning $200k or more, 2022: 43.7% Newton, Massachusetts Median income, 2023: $185,154 Median income, 2022: $163,074 One-year change in median income: 13.54% Percent of households earning $100k or more, 2023: 72.1% Percent of households earning $100k or more, 2022: 67.1% Percent of households earning $200k or more, 2023: 47.3% Percent of households earning $200k or more, 2022: 42.4% Palo Alto, California Median income, 2023: $184,068 Median income, 2022: $179,707 One-year change in median income: 2.43% Percent of households earning $100k or more, 2023: 68.9% Percent of households earning $100k or more, 2022: 70.7% Percent of households earning $200k or more, 2023: 46.9% Percent of households earning $200k or more, 2022: 45.6% Mountain View, California Median income, 2023: $181,671 Median income, 2022: $165,448 One-year change in median income: 9.81% Percent of households earning $100k or more, 2023: 71.6% Percent of households earning $100k or more, 2022: 69.5% Percent of households earning $200k or more, 2023: 45.2% Percent of households earning $200k or more, 2022: 43.3% Milpitas, California Median income, 2023: $179,727 Median income, 2022: $169,818 One-year change in median income: 5.84% Percent of households earning $100k or more, 2023: 72.9% Percent of households earning $100k or more, 2022: 72.3% Percent of households earning $200k or more, 2023: 47.2% Percent of households earning $200k or more, 2022: 41.7% Pleasanton, California Median income, 2023: $177,535 Median income, 2022: $183,969 One-year change in median income: -3.50% Percent of households earning $100k or more, 2023: 75.9% Percent of households earning $100k or more, 2022: 74.6% Percent of households earning $200k or more, 2023: 43.8% Percent of households earning $200k or more, 2022: 47.5% Redmond, Washington Median income, 2023: $172,979 Median income, 2022: $152,851 One-year change in median income: 13.17% Percent of households earning $100k or more, 2023: 70.5% Percent of households earning $100k or more, 2022: 68.5% Percent of households earning $200k or more, 2023: 42.8% Percent of households earning $200k or more, 2022: 34.5% Data and Methodology SmartAsset examined data for estimated local median household incomes from the U.S. Census Bureau for 2023 and 2022 for 636 cities with available data and a population of at least 65,000. The percentage of households earning at least $100,000 and at least $200,000 in each year was also examined. This story was produced by SmartAsset and reviewed and distributed by Stacker.
Where income increased most across the US