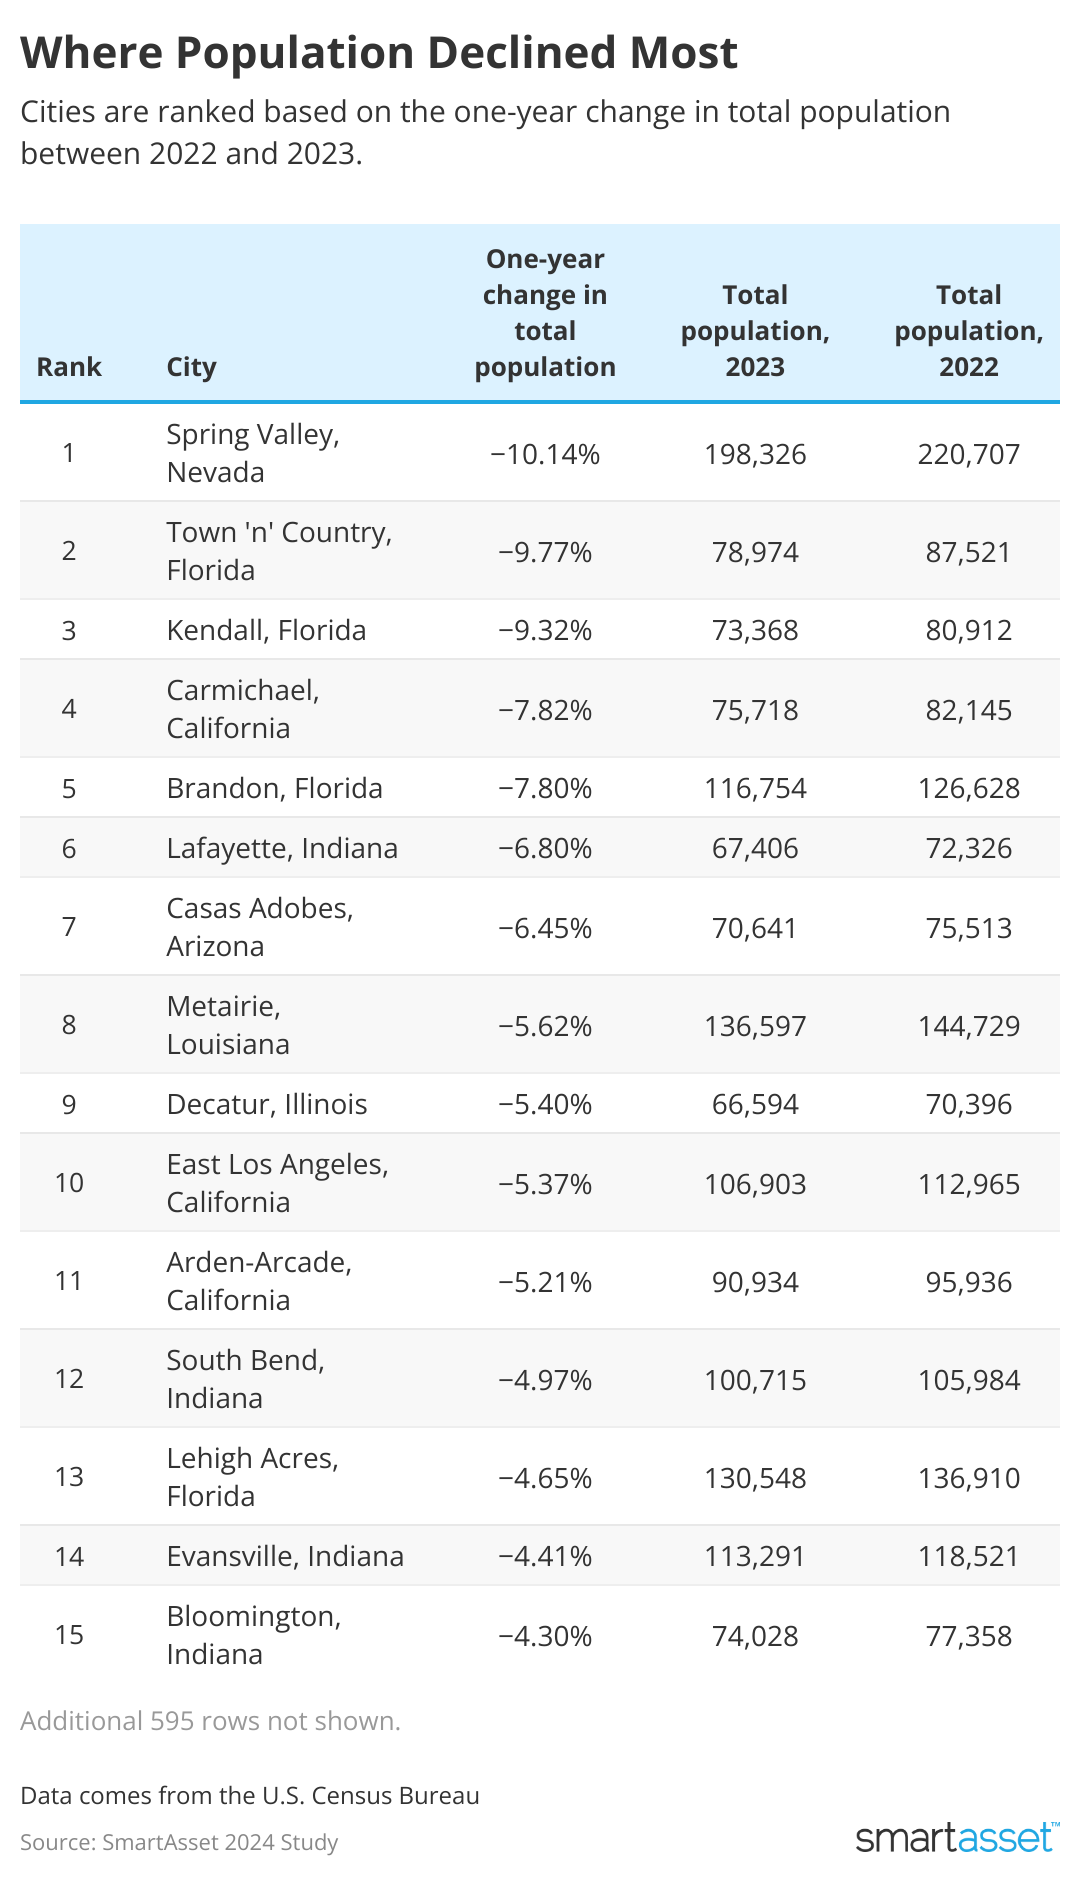
Roig61 // Shutterstock Declines in a community’s population can result in a decreased demand for businesses, housing, and services. This could potentially lead to higher per capita costs among the remaining tax base for maintaining infrastructure and even the closure of local amenities. Additionally, an aging or shrinking population can affect the local job market and culture, among other things. Keeping this in mind, SmartAsset ranked 610 cities across the U.S. based on the one-year decline in population, drawing on recent Census Bureau estimates. Five-year declines were also analyzed, along with changes in the working-age population to understand broader trends. Key Findings The population declined by more than 10% in one year in this city. Spring Valley, NV saw the largest one-year decline at 10.14%. The total population decreased from 220,707 in 2022 to 198,326 in 2023. The relative size of the working age population remained stable at around 51% each year. Over five years, this city lost more than one quarter of its population. Paradise, NV saw the largest five-year decline in population at -26.77%. It lost nearly 65,000 residents between 2018 and 2023, going from 242,266 to 177,413. For one-year loss, it ranked 17th, indicating a continued trend as of the most recent data. Two Texas cities saw steep declines in the working age population. Despite a steady increase in total population over the last five years, Forth Worth, TX lost 47,312 working age residents from 2018 to 2023. And New Braunfels, TX – which ranked second overall for one-year population decline with a loss of 12.49% of its total population, and had a five-year loss of 29.68% – saw a 6.8 point decline in its relative population of workers during those five years after losing 19,398 people between age 20 and 54. Top 10 Cities With the Largest One-Year Population Decline SmartAsset Spring Valley, Nevada One-year change in total population: -10.14% Five-year change in total population: -7.39% Total population, 2023: 198,326 Total population, 2022: 220,707 Total population, 2018: 214,161 One-year change in the number of working-age residents: -10.21% Number of working-age residents, 2023: 101,553 Percent of population of working age, 2023: 51.21% Number of working-age residents, 2022: 113,105 Percent of population of working age, 2022: 51.25% Town ‘n’ Country, Florida One-year change in total population: -9.77% Five-year change in total population: -4.36% Total population, 2023: 78,974 Total population, 2022: 87,521 Total population, 2018: 82,577 One-year change in the number of working-age residents: -9.44% Number of working-age residents, 2023: 41,641 Percent of population of working age, 2023: 52.73% Number of working-age residents, 2022: 45,983 Percent of population of working age, 2022: 52.54% Kendall, Florida One-year change in total population: -9.32% Five-year change in total population: -3.44% Total population, 2023: 73,368 Total population, 2022: 80,912 Total population, 2018: 75,979 One-year change in the number of working-age residents: -5.73% Number of working-age residents, 2023: 31,099 Percent of population of working age, 2023: 42.39% Number of working-age residents, 2022: 32,988 Percent of population of working age, 2022: 40.77% Carmichael, California One-year change in total population: -7.82% Five-year change in total population: 15.90% Total population, 2023: 75,718 Total population, 2022: 82,145 Total population, 2018: 65,328 One-year change in the number of working-age residents: -12.94% Number of working-age residents, 2023: 32,764 Percent of population of working age, 2023: 43.27% Number of working-age residents, 2022: 37,634 Percent of population of working age, 2022: 45.81% Brandon, Florida One-year change in total population: -7.80% Five-year change in total population: -2.52% Total population, 2023: 116,754 Total population, 2022: 126,628 Total population, 2018: 119,778 One-year change in the number of working-age residents: -13.67% Number of working-age residents, 2023: 56,138 Percent of population of working age, 2023: 48.08% Number of working-age residents, 2022: 65,028 Percent of population of working age, 2022: 51.35% Lafayette, Indiana One-year change in total population: -6.80% Five-year change in total population: -6.89% Total population, 2023: 67,406 Total population, 2022: 72,326 Total population, 2018: 72,393 One-year change in the number of working-age residents: -9.86% Number of working-age residents, 2023: 33,994 Percent of population of working age, 2023: 50.43% Number of working-age residents, 2022: 37,712 Percent of population of working age, 2022: 52.14% Casas Adobes, Arizona One-year change in total population: -6.45% Five-year change in total population: -6.68% Total population, 2023: 70,641 Total population, 2022: 75,513 Total population, 2018: 75,694 One-year change in the number of working-age residents: -3.83% Number of working-age residents, 2023: 30,450 Percent of population of working age, 2023: 43.11% Number of working-age residents, 2022: 31,664 Percent of population of working age, 2022: 41.93% Metairie, Louisiana One-year change in total population: -5.62% Five-year change in total population: -3.20% Total population, 2023: 136,597 Total population, 2022: 144,729 Total population, 2018: 141,114 One-year change in the number of working-age residents: -6.88% Number of working-age residents, 2023: 58,233 Percent of population of working age, 2023: 42.63% Number of working-age residents, 2022: 62,535 Percent of population of working age, 2022: 43.21% Decatur, Illinois One-year change in total population: -5.40% Five-year change in total population: -7.33% Total population, 2023: 66,594 Total population, 2022: 70,396 Total population, 2018: 71,860 One-year change in the number of working-age residents: -2.17% Number of working-age residents, 2023: 28,489 Percent of population of working age, 2023: 42.78% Number of working-age residents, 2022: 29,121 Percent of population of working age, 2022: 41.37% East Los Angeles, California One-year change in total population: -5.37% Five-year change in total population: -9.37% Total population, 2023: 106,903 Total population, 2022: 112,965 Total population, 2018: 117,961 One-year change in the number of working-age residents: -9.20% Number of working-age residents, 2023: 53,085 Percent of population of working age, 2023: 49.66% Number of working-age residents, 2022: 58,463 Percent of population of working age, 2022: 51.75% Top 10 Cities With the Largest Five-Year Population Decline Paradise, Nevada Five-year change in total population: -26.77% One-year change in total population: -3.22% Total population, 2023: 177,413 Total population, 2022: 183,321 Total population, 2018: 242,266 One-year change in the number of working-age residents: -4.77% Number of working-age residents, 2023: 90,712 Percent of population of working age, 2023: 51.13% Number of working-age residents, 2022: 95,254 Percent of population of working age, 2022: 51.96% Flint, Michigan Five-year change in total population: -16.97% One-year change in total population: -0.26% Total population, 2023: 79,654 Total population, 2022: 79,865 Total population, 2018: 95,932 One-year change in the number of working-age residents: 4.63% Number of working-age residents, 2023: 36,642 Percent of population of working age, 2023: 46% Number of working-age residents, 2022: 35,022 Percent of population of working age, 2022: 43.85% Arden-Arcade, California Five-year change in total population: -15.72% One-year change in total population: -5.21% Total population, 2023: 90,934 Total population, 2022: 95,936 Total population, 2018: 107,894 One-year change in the number of working-age residents: -5.09% Number of working-age residents, 2023: 44,761 Percent of population of working age, 2023: 49.22% Number of working-age residents, 2022: 47,164 Percent of population of working age, 2022: 49.16% Bloomington, Indiana Five-year change in total population: -14.44% One-year change in total population: -4.30% Total population, 2023: 74,028 Total population, 2022: 77,358 Total population, 2018: 86,522 One-year change in the number of working-age residents: -4.17% Number of working-age residents, 2023: 42,769 Percent of population of working age, 2023: 57.77% Number of working-age residents, 2022: 44,632 Percent of population of working age, 2022: 57.70% Miami Beach, Florida Five-year change in total population: -13.19% One-year change in total population: -0.51% Total population, 2023: 79,616 Total population, 2022: 80,027 Total population, 2018: 91,715 One-year change in the number of working-age residents: -12.48% Number of working-age residents, 2023: 36,656 Percent of population of working age, 2023: 46.04% Number of working-age residents, 2022: 41,885 Percent of population of working age, 2022: 52.34% Aurora, Illinois Five-year change in total population: -13.10% One-year change in total population: -1.63% Total population, 2023: 179,355 Total population, 2022: 182,336 Total population, 2018: 206,389 One-year change in the number of working-age residents: -2.68% Number of working-age residents, 2023: 89,235 Percent of population of working age, 2023: 49.75% Number of working-age residents, 2022: 91,689 Percent of population of working age, 2022: 50.29% Jackson, Mississippi Five-year change in total population: -12.80% One-year change in total population: -1.63% Total population, 2023: 143,633 Total population, 2022: 146,019 Total population, 2018: 164,720 One-year change in the number of working-age residents: -2.30% Number of working-age residents, 2023: 66,858 Percent of population of working age, 2023: 46.55% Number of working-age residents, 2022: 68,434 Percent of population of working age, 2022: 46.87% Union City, California Five-year change in total population: -12.27% One-year change in total population: -2.44% Total population, 2023: 65,416 Total population, 2022: 67,049 Total population, 2018: 74,568 One-year change in the number of working-age residents: -7.04% Number of working-age residents, 2023: 30,853 Percent of population of working age, 2023: 47.16% Number of working-age residents, 2022: 33,189 Percent of population of working age, 2022: 49.50% Pine Hills, Florida Five-year change in total population: -11.99% One-year change in total population: 9.66% Total population, 2023: 79,274 Total population, 2022: 72,291 Total population, 2018: 90,070 One-year change in the number of working-age residents: 7.67% Number of working-age residents, 2023: 35,932 Percent of population of working age, 2023: 45.33% Number of working-age residents, 2022: 33,372 Percent of population of working age, 2022: 46.16% El Monte, California Five-year change in total population: -10.22% One-year change in total population: -1.45% Total population, 2023: 103,782 Total population, 2022: 105,307 Total population, 2018: 115,602 One-year change in the number of working-age residents: 0.03% Number of working-age residents, 2023: 48,130 Percent of population of working age, 2023: 46.38% Number of working-age residents, 2022: 48,114 Percent of population of working age, 2022: 45.69% Data and Methodology SmartAsset examined population estimates from the Census Bureau for 2023, 2022 and 2018 to determine one-year and five-year population changes for cities with populations of at least 65,000 in 2023 for which full data was available. Changes in the working age population were also examined, with working age defined as between ages 20 and 54. This story was produced by SmartAsset and reviewed and distributed by Stacker.
Population declined the most in these US cities